Update: June 2021
All the below still remains true, but a lot has happened in the world of Zsh performance over the last few years, in no small part due to Apple changing its default shell to zsh.
An incredible theme and tool called powerlevel10k that fixes a lot of the most common complaints. The article below is still good for learning how to debug zsh extensions and plugins, but I'd try migrating to powerlevel10k and seeing if it solves your problems.
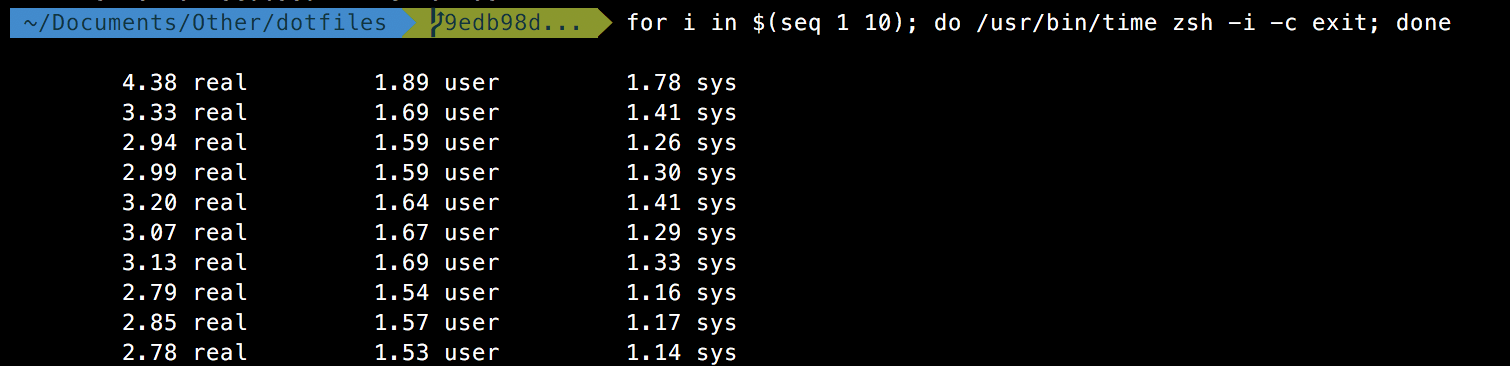
I was opening multiple shells for an unrelated project today and noticed how abysmal my shell load speed was. After the initial load it was relatively fast, but the actual shell start up was noticeably slow. I timed it with time and these were the results.
Original zsh profile
You can time your own shell with:
for i in $(seq 1 10); do /usr/bin/time $SHELL -i -c exit; doneRaw bash, as a comparison, was blazing fast - it averaged 0.03 seconds, with about 0.02 in user-land and 0.01 in kernel. This is with an empty .bashrc and other dotfiles, so it would prove to be a lower bound/goal.
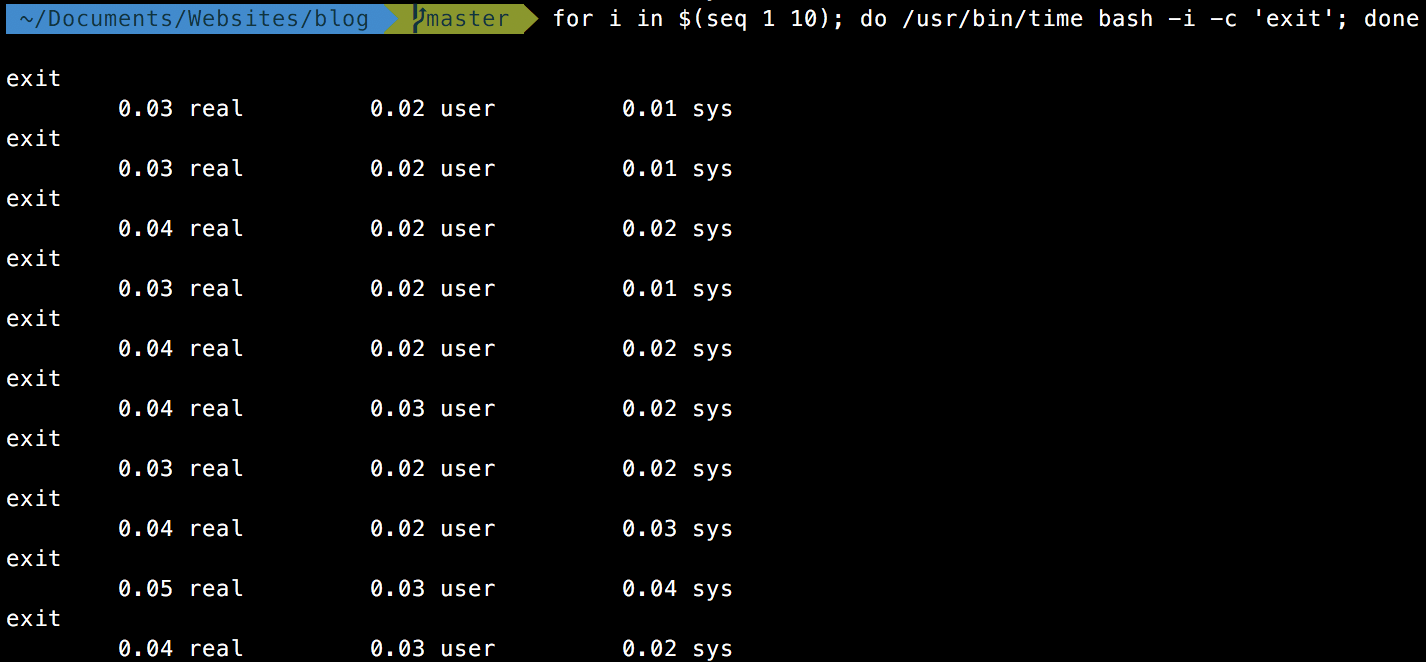
Raw bash speeds
I was averaging 3.14 seconds, with 1.64 in user-land and 1.5 in kernel-land.
My zsh set up was nearly 100x slower than raw bash. I wanted to investigate what was going on, and why it was so much slower.
Intro
Before we begin, it might be helpful to understand how shells in general start up. Shells are just an executable like any other on your machine - their purpose is to just take user input and behave like an old terminal. They have predefined control sequences, but in general are fairly extensible. The following is from ZSH man pages:
Commands are first read from /etc/zshenv; this cannot be overridden. ... Commands are then read from $ZDOTDIR/.zshenv. If the shell is a login shell, commands are read from /etc/zprofile and then $ZDOTDIR/.zprofile. Then, if the shell is interactive, commands are read from /etc/zshrc and then $ZDOT-DIR/.zshrc. Finally, if the shell is a login shell, /etc/zlogin and $ZDOTDIR/.zlogin are read.
When a login shell exits, the files $ZDOTDIR/.zlogout and then /etc/zlogout are read.
The following files are read:
$ZDOTDIR/.zshenv
$ZDOTDIR/.zprofile
$ZDOTDIR/.zshrc
$ZDOTDIR/.zlogin
$ZDOTDIR/.zlogout
${TMPPREFIX}*   (default is /tmp/zsh*)
/etc/zshenv
/etc/zprofile
/etc/zshrc
/etc/zlogin
/etc/zlogout    (installation-specific - /etc is the default)
This gives a general flow of execution, and where zsh starts. My .zshrc leads to sourceing a few other files, which just behaves as if the contents of those files was passed directly into the shell as standard input.
Profiling
We can start by profiling raw zsh - it's even faster than raw bash.
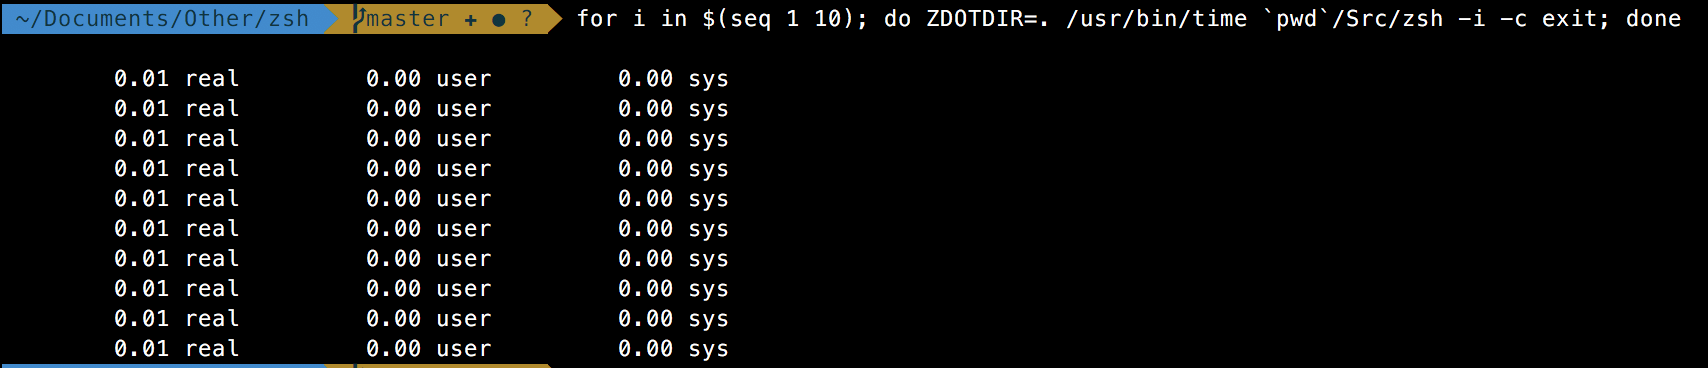
Raw zsh speeds
The first step is to figure out exactly what's taking so long - there are a variety of tools to measure performance, but the most useful will be zsh's native debug tools.
zsh -xvThis enables xtraceing and verbose output. It's not particularly great for time analysis, though - it does not include timestamps, so we have to eyeball the speed. It's easy to catch a few immediate culprits - for instance, mine hung for at least a second on loading nvm. Anything that is a few orders of magnitude slower than the other commands will stick out like a sore thumb.
The second is an order-blind profiler - at the top of .zshrc, insert zmodload zsh/zprof. This will enable the built in profiling.
At the end of .zshrc insert zprof.
The output will look as follows:
num calls time self name
- 1 177.88 177.88 33.99% 177.88 177.88 33.99% compdump
- 1 485.28 485.28 92.72% 172.35 172.35 32.93% compinit
- 658 118.96 0.18 22.73% 118.96 0.18 22.73% compdef
- 2 16.41 8.21 3.14% 16.41 8.21 3.14% compaudit
- 2 10.27 5.13 1.96% 10.27 5.13 1.96% env_default ...
This will tell us exactly where zsh is spending most of it's time.
Fixing the problem
I started by playing around with high-level entry points. For instance, disabling source $ZSH/oh-my-zsh.sh from my ~/.zshrc cut my load time down by half, to roughly 1.7 seconds average. I then disabled nvm and my times plummeted. I had found the main two culprits of slow load times.
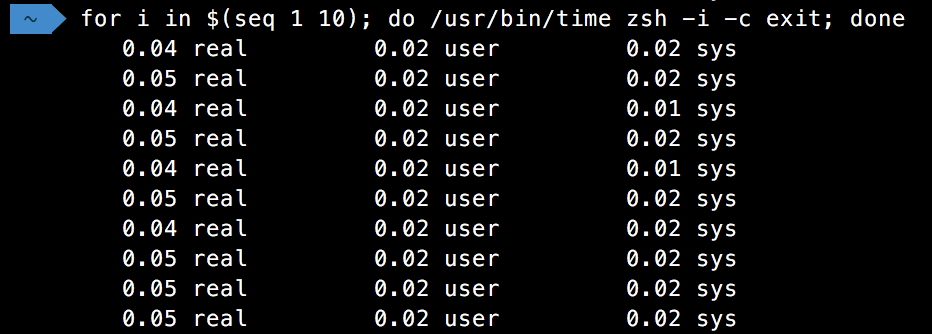
Zsh speeds with no Oh my zsh or nvm
My new average had become only 40 milliseconds. I didn't want to lose the functionality that oh-my-zsh provided, however, so I looked into improving it.
I started profiling specific subsections of oh-my-zsh like so:
# I use gdate from brew's core-utils because macOS date does not support nanoseconds
timer=$(($(gdate +%s%N)/1000000))

# Original .zshrc/config file

now=$(($(gdate +%s%N)/1000000))
elapsed=$(($now-$timer))
echo $elapsed":" $plugin
I wrapped all the plugin loading and sourcing, and profiled each one.
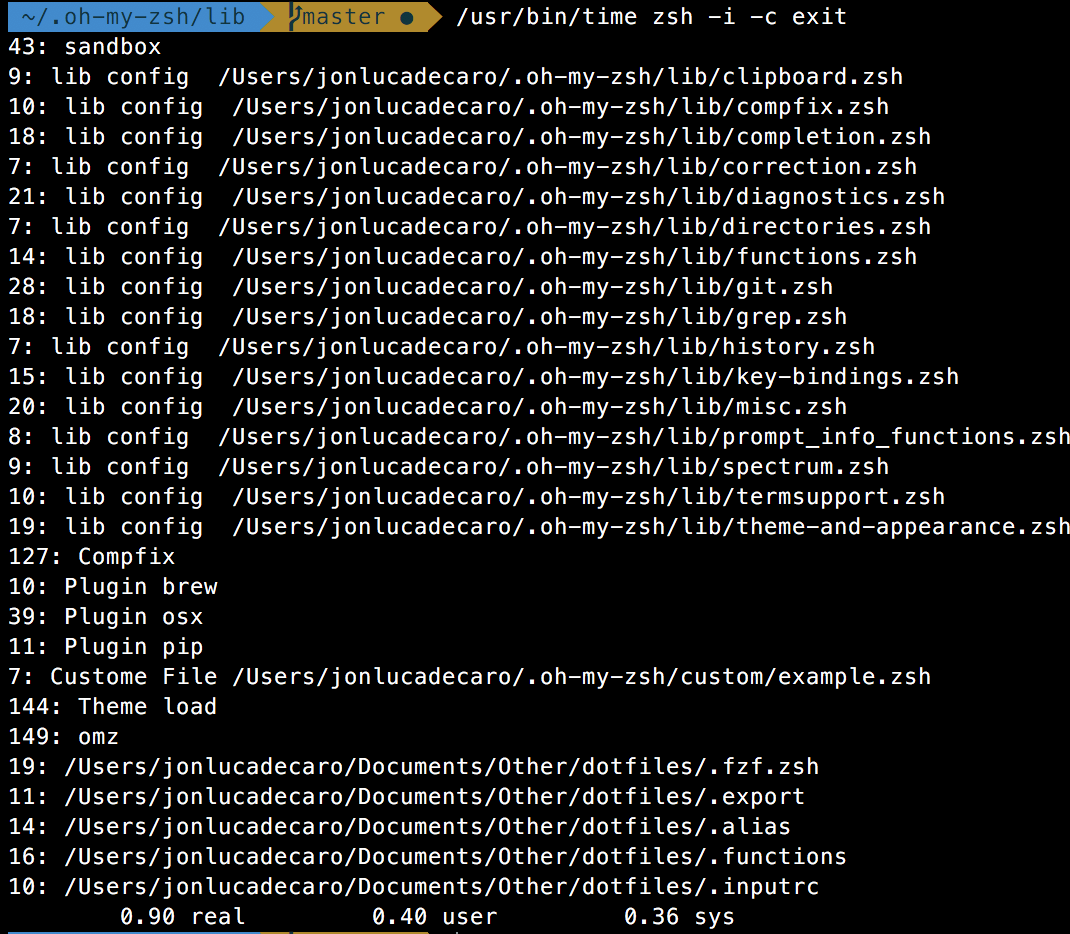
Profile functions
The plugin command-not-found was the main slow down of Oh-My-Zsh. I went through and disabled the plugins I didn't use much and got my shell load time down.
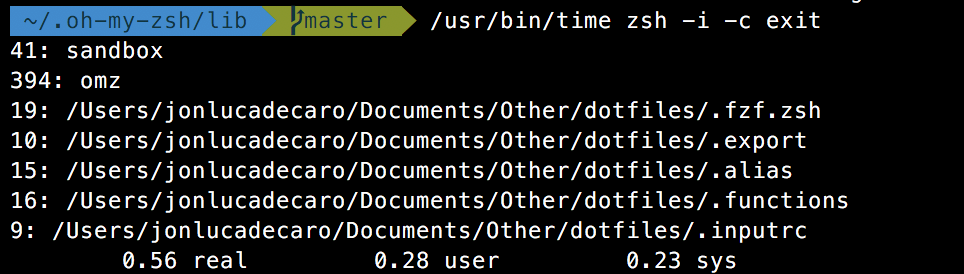
Post changes to startup
My new shell start time was about half a second. Oh-My-Zsh still took up the majority of it, but I believe it to be a valuable addition. I do wish it put a bit more of an emphasis on performance, however.
The last thing to do is to lazy load functions and services that I don't need. I found a great sandbox lazyloader here that was useful for nvm/rvm. Any command invocation of nvm from terminal, script, or otherwise still succeeds, it just gets lazy loaded the first time it's invoked.
Observations
Oh-My-Zsh is great and provides a lot of functionality, but it comes at a fairly heavy cost. As you can see above, its overhead accounts for nearly 70% of my load time.
There is one other thing of note - oh-my-zshzsh provides a built in function, vcs_info, to provide information about the the version control status of the current working directory. However, this is quite slow! For the actual Zsh git repo, it takes about 200ms to parse. In large projects with a heavy git history this will hang your prompt return time for seconds. This won't necessarily impact shell start time, but it will impact the amount of time it takes to actually display the prompt when navigating within a VCS-belonging directory. This can be slightly fixed with git config oh-my-zsh.hide-status 1 on problematic repos, but it would be nice if it did so automatically. Setting the option DISABLE_UNTRACKED_FILES_DIRTY="true" in your .zshrc can help as well, but comes with a loss of functionality.
Finally, a lot of time is spent in compinit and compdef. These are functions that create/define entries in the local completions cache (the ~/.zcompdump-machinename file you might've noticed). There are a few hacks floating around GitHub, HackerNews, and various forums that try to remedy this (only check once a day, only check on new shell logins, etc), but none are particularly robust/without side effects.
Conclusion
In the future I hope to actually recompile zsh with additional profiling techniques and debug information - keeping an internal timer and having a flag output current time for each command in a tree fashion would make building heat maps really easy.
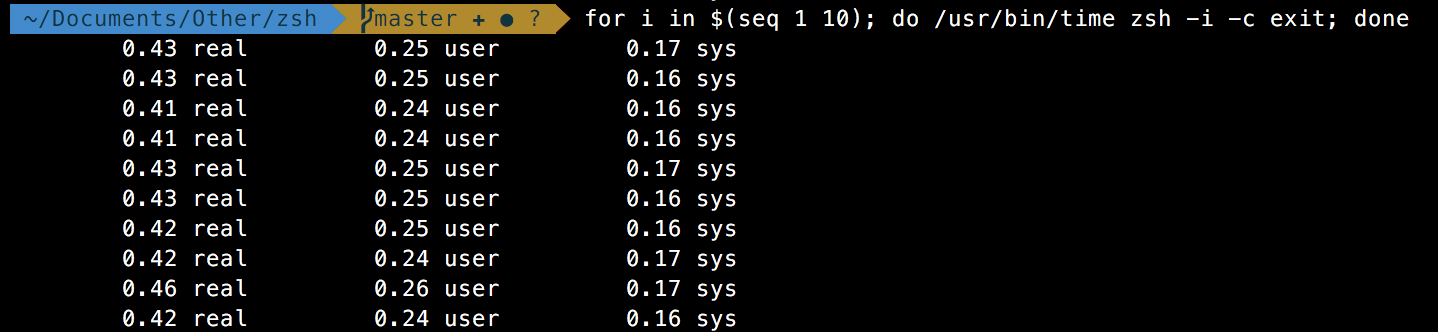
Final zsh speeds
I ended with zsh taking about 0.42 seconds, or 420 milliseconds, to start up. Disabling Oh-My-Zsh gets the average down further to roughly 50ms. For now the extra 380 or so milliseconds are worth it, but I might be tempted to try another framework if I can't get it any faster.
Final Note
While initial start time can (and should) be optimized, it pales in comparison to the importance of prompt return time.
In a typical workflow you're returning to your prompt hundreds of times more than you're actually starting new shell sessions. I'd like to profile prompt time much more, as I've noticed that even a 10% gain is noticeable (and much more important, as waiting any longer than half a second for a prompt will quickly become infuriating). As mentioned above, my largest culprit for prompt return time was vcs_info - I mostly work out of directories that have a git repo attached, and it's very noticeable there.
Resources
Here are a few resources I consulted while working on this post.
- https://gist.github.com/ctechols/ca1035271ad134841284
- https://carlosbecker.com/posts/speeding-up-zsh/
- https://wpsuperheroes.com/slow-osx-terminal-oh-my-zsh/
- https://bennycwong.github.io/post/speeding-up-oh-my-zsh/
- https://github.com/robbyrussell/oh-my-zsh/issues/5327
- https://github.com/robbyrussell/oh-my-zsh/issues/6056
- https://blog.peiyingchi.com/2017/08/17/speed-up-oh-my-zsh/
- https://superuser.com/questions/236953/zsh-starts-incredibly-slowly
- https://blog.patshead.com/2011/04/improve-your-oh-my-zsh-startup-time-maybe.html
- https://github.com/benvan/sandboxd
Additionally, the specific dot files that I used above, in their original state, can be found here.