Snapshotting memory to scrape encrypted network requests
Most web reverse engineering focuses on two attack surfaces - either DOM scraping through something like puppeteer or beatifulsoup, or on MITM attacks to reverse network calls.
The former is what most traditional scraping looks like - you manually inspect a web page, you determine the right xpath/css selectors to follow, and then instruct a scraper to statically request the page and scrape it.
The rise of SPAs has made this approach a bit less impractical - you now have to actually render the content, which is is significantly slower, to have the content you want to scrape show up in the DOM.
At the same time, it made web scraping as a whole much easier - sites that used to be server rendered now have nice, machine readable routes that serve JSON. This has lead to tools like Burp Suite and Charles Proxy being coopted from their original use of finding security vulnerabilities to being primarily used for web scraping.
In this article I want to introduce a third, more niche attack surface for scraping web pages - scraping through memory snapshots and their respective dominator graph. It’s particularly applicable when the client is encrypting its network requests and responses.
Chrome Devtools
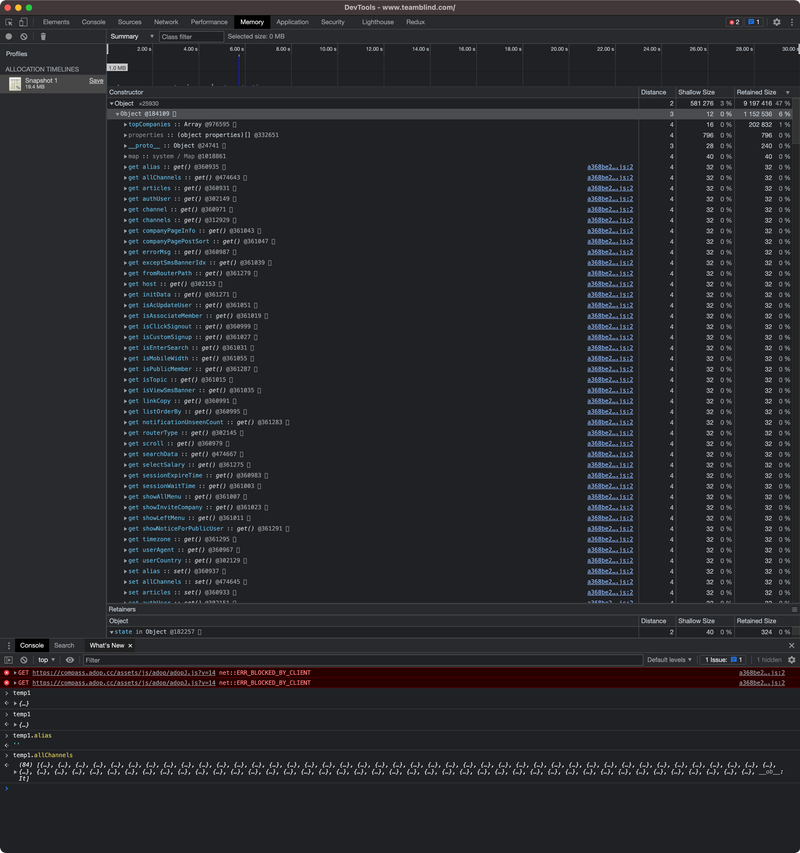
Devtools has a nice feature to detect memory leaks - the Memory tab.

It will take a snapshot of the current tabs memory, and built a graph out of it to inspect.
The memory tab is mostly used to compare different memory snapshots - you take a snapshot, perform some actions on the page, take another snapshot, and look at everything that got allocated to see if there are any memory leaks.
Since it’s pretty much a full memory snapshot, it stores all strings and objects - which, for something like React or Vue, will include all props and (typically) network request responses.
Memory snapshots
Inspecting memory isn’t new in the reverse engineering space - for native apps, it’s one of the most common ways of finding out what an application is doing and how its internal logic is structured.
Within the web world, though, it’s hardly ever used. Most of the literature online is regarding finding memory leaks. All the tools and software around it are therefore built around that - they don’t care about the contents of the memory, they care about the origination source/allocator and the references/dominators to it.
When does this make sense?
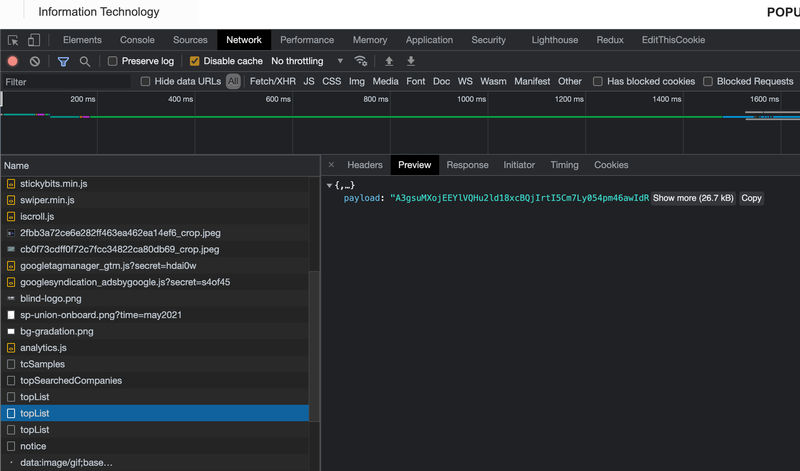
Using memory snapshots makes sense in two cases - 1), when the client encrypts the network response, and you don’t have the time or energy to reverse the bundle to understand how to decrypt it programatically (like in Blind’s case, which I did here) and 2) when the client requests are machine readable, but there are multiple requests that get stitched together in memory to create the desired objects.

Reversing the spec
Saving a memory snapshot generates a heapsnapshot file - this is a JSON file with a given format, that is not document anywhere as far as I can tell. These snapshots are the same in Node and in Chrome, and all documentation for both just tell you to upload it to the memory tab in a new devtools instance to view it.
Luckily the code for devtools is public, so I managed to reverse it and turn it into a CLI tool - this accepts heapsnapshots as inputs, and can parse them into the graph.
Extracting JSON
At this point, you can just go through and try and parse every string in memory as JSON, and see what sticks around. This will be an easy way to find in memory JSON strings - however, these aren’t as common as you might think. The v8 compiler is pretty efficient in knowing what to keep in memory and what to discard, so it’ll typically just keep the parsed objects.
Reconstructing objects
You can reconstruct objects in memory by traversing through the graph and stitching the nodes together - everything ends up being a primitive, and graph nodes can just contain properties, so they’re proxies for objects.

It’s useful to sort by retained size (which the code in the repo has a function for), and look at the heaviest objects - these are typically going to be your most interesting allocations, especailly if you perform an allocation recording.
Future plans
The code for the project can be found here, which will parse any chrome or node heapsnapshot.. In part 2 I’m going to add the ability to fully reconstruct objects from this graph.
JonLuca at 10:06
